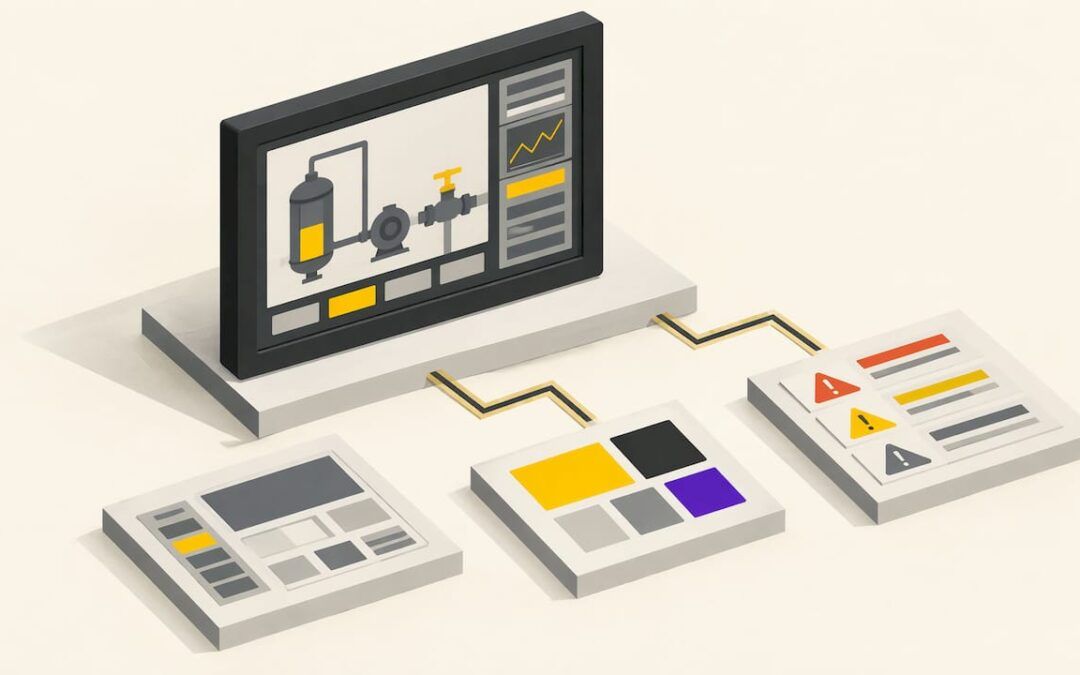
Good HMI screen design makes normal operation look calm, makes abnormal conditions impossible to miss, and lets an operator find the right detail in a few predictable steps. In practice that means a gray, low-glare background, color reserved for things that need attention, a clear display hierarchy, and alarms shown by more than color alone. This guide walks through each of those decisions, the mistakes that undo them, and how to apply them when you build screens in FactoryTalk View.
TL;DR
- Design for the operator’s questions: is the process normal, what changed, and what should I do next.
- Use a gray background and keep color for abnormal conditions. Alarm colors belong to alarms only.
- Organize screens in no more than four levels, from a plant overview down to diagnostics.
- Show values against a scale with normal, abnormal and alarm ranges, not as bare numbers.
- Never rely on color alone. Back it up with shape, text or position.
Table of Contents
- What HMI screen design actually covers
- Start with a style guide, not a blank screen
- Organize screens in levels
- Color, contrast and visual hierarchy
- Show information, not just data
- Displaying alarms and abnormal conditions
- Common HMI screen design mistakes
- HMI or SCADA: where screen design sits
- Putting it into practice in FactoryTalk View
- A quick review checklist before you release a screen
- Perspective: why design skill is learned by building
- Learn HMI design with a real project
- FAQ
- Sources
What HMI screen design actually covers
The HMI is more than one picture on a panel. ISA describes it as the screens, graphic displays, keyboards, switches and other technologies an operator uses to monitor and interact with a control system. Its design shapes how well an operator manages operations, especially when something goes wrong.
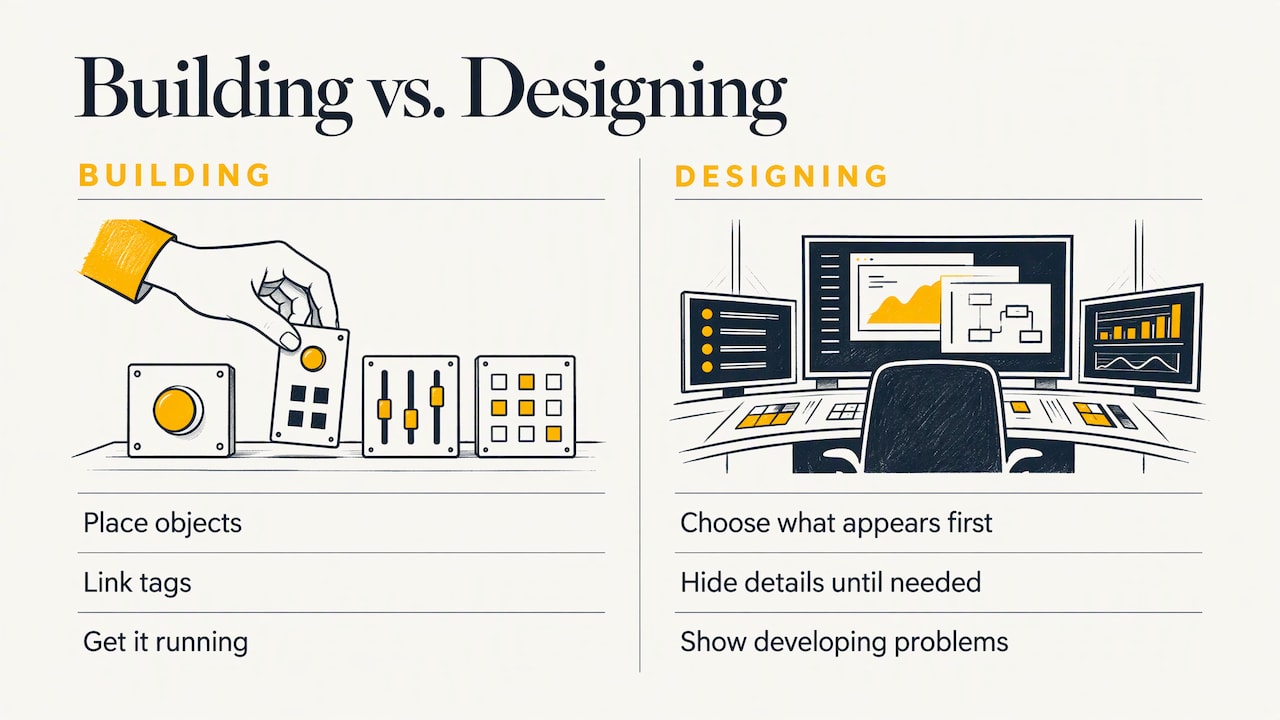
That is why screen design is a different job from screen building. Building is placing objects, linking tags and getting the thing to run. Designing is deciding what the operator sees first, what stays hidden until needed, and how a developing problem announces itself.
A useful test is to imagine three questions an operator asks all shift: Is the process operating normally? What has changed? What action should I take? Fuji Electric’s HMI design article frames good design around exactly those questions and around reducing cognitive effort, not around appearance. Every layout choice below serves one of them.
The design discipline also has a formal home. The ISA-101 series of standards gives a lifecycle framework for designing, implementing, operating and improving HMIs, and it applies to continuous, batch and discrete industries. You do not need to read the standard before drawing your first screen, but its ideas run through everything here.
Start with a style guide, not a blank screen
The most common reason a plant ends up with ten screens in ten different styles is that nobody wrote down the rules. An IPD white paper on high-performance HMI recommends that the facility owner develop an HMI philosophy document and a style guide, and build reusable toolkits of screen elements to improve efficiency and reduce human error.
For a single machine or a small line, a one-page version is enough. Decide and write down:
- Background color and the small palette of colors allowed on top of it.
- Which colors mean alarm, and that nothing else may use them.
- Standard sizes and positions for the navigation bar, alarm banner and title.
- How a pump, valve, motor or analog value is drawn, once, as a reusable object.
- How numeric entry works, including limits and confirmation.
Then build the objects once and copy them. In FactoryTalk View, global objects exist for exactly this reason: change the master and every instance follows. Consistency also speeds up commissioning, because the tenth screen takes a fraction of the time of the first.
Organize screens in levels
Operators cannot hold a whole plant in their heads, so the screens should do it for them. The ISA-101 hierarchy as summarized by Control Global works like this:
| Level | Purpose | Typical content |
|---|---|---|
| 1 | Overview of the operator’s whole span of control | Key indicators, alarm summary, status of each area |
| 2 | Operating display for a major area or unit | The controls and values used to run that area |
| 3 | Detailed display for general troubleshooting | Equipment detail, control modules, interlock status |
| 4 | Auxiliary display for focused troubleshooting | Diagnostics, device information, occasional tasks |
ISA-101 recommends no more than four levels, according to a Yokogawa summary. Rockwell Automation’s Process HMI Style Guide describes the same idea as progressive disclosure: a clean, simple overview leads to screens with more complexity and detail as the user navigates deeper.
For a stand-alone machine, you will rarely need all four. A packaging line might use an overview screen (Level 1), one screen per station with controls (Level 2), and a diagnostics screen for drives, sensors and I/O faults (Levels 3 and 4). The principle holds at any size: summary first, detail on demand, and few steps between them.
Navigation that operators can predict
A permanent navigation bar in the same place on every screen does more for usability than any visual polish. The Fuji Electric article recommends that operators reach relevant detail in a small number of predictable actions. Put the top-level buttons in a fixed position, highlight the current screen, and keep the alarm banner visible everywhere.
One practical rule of thumb: if a technician has to remember where a diagnostic screen lives, it is buried too deep. Link faults directly to the screen that explains them. If you build in FactoryTalk View SE, our walkthrough of an Allen Bradley PLC navigation header shows a reusable approach.
Match the layout to the plant
Process flow should read consistently across screens. The IPD white paper suggests flow generally runs left to right, with vapors up and liquids down. Spatial memory matters too. Operators who come from the field carry a mental map of the plant, and layouts that contradict physical reality force them to remap every interaction. If a tank sits above a pump on site, draw it that way.
Color, contrast and visual hierarchy
Color is the most abused tool in HMI design. When everything is bright, nothing stands out, and a real problem gets lost in the noise. The ISA overview of high-performance graphics gives the working rules: gray backgrounds to minimize glare, limited and consistent use of color, and bright colors to draw attention to abnormal situations rather than to show normal ones.
A practical color approach
- Background: light or medium gray, not black or saturated blue. The IPD paper recommends light gray to reduce glare and operator fatigue.
- Equipment: draw vessels, pumps and piping in 2D with low-contrast, muted tones. Avoid shading and gradients.
- Normal status: neutral. A running motor does not need to be bright green, and a stopped one does not need to be bright red. Saturated colors for ordinary running and stopped states are a listed cause of lost attention.
- Abnormal conditions: this is where bright color goes. Yellow or amber for warnings, red for critical alarms, used only for that.
- Live data: the IPD paper suggests showing live values differently from static text, with a distinct color such as blue, so the operator can tell a number from a label.
Never let color work alone
Color must not be the only signal for an important condition. Provire’s guidance on color in process displays points out that several common color-vision deficiencies exist, particularly among men, and recommends redundant coding with something other than color. Control Engineering makes the same point for alarm indicators: distinguish them by shape as well as color, and use no more than three colors on an object. A good check is to view your screen in grayscale. If you can still tell what is wrong, the design holds up.
Show information, not just data
A lone number such as 74.2 tells an inexperienced operator very little. Is that good? Is it drifting? The ISA overview recommends analog indicators that show a value relative to normal, abnormal and alarm conditions, plus embedded trends of important parameters. The IPD paper puts it simply: data is not information, and a value needs a scale, a desirable operating range, an alarm range and an indicator of whether performance is good, normal or poor.
In practice, replace a bare numeric field with a small bar or gauge that has the normal band marked, keep the number beside it, and add a short trend where history matters. Operators see a drift toward a limit before the alarm ever trips.
There is a training benefit as well. The high-performance HMI reference at idc-online.com argues that when knowledge of desirable operating conditions is built into the display, it reduces variability between operators and shortens training time, because the knowledge is not learned hit-or-miss through experience.
Displaying alarms and abnormal conditions
Alarm display is where HMI design is most tightly tied to safety and uptime. Rockwell’s Process HMI Style Guide sets out the main points:
- Alarms are redundantly coded by color, shape and text, so presence and priority are clear.
- Unacknowledged alarms blink until acknowledged. Acknowledged alarms stay in a solid alarm color until the condition clears.
- Alarm colors, typically red for critical and amber or yellow for warning, are used for alarms only and never for decoration.
- A prioritized banner shows the latest and highest-priority alarms, and alarms also appear next to the equipment causing them.
- The display should let the operator identify the deviation, its direction and the required action within roughly five seconds.
What counts as an alarm matters before any of it is drawn. ANSI/ISA-18.2 defines an alarm as a means of indicating an equipment malfunction, process deviation or abnormal condition that requires a response. If a message needs no response, it is information, and it belongs somewhere other than the alarm banner.
Volume matters as well. The Rockwell guide treats more than 10 alarms in 10 minutes as an alarm flood that needs special display handling, a threshold that matches the ISA-18.2 definition. Alarm rationalization happens in the control system, not on the screen, but your display decides how a flood looks. A banner that scrolls endlessly helps nobody, so group by area and priority.
Power and nuclear control rooms have studied this in depth. EPRI’s alarm system guidance describes presenting alarms at the plant level, at the level of major systems, and at component level, with continuously visible displays showing which parts of the plant are affected. The same layering works in a small plant: overview indicator, area indicator, equipment indicator.
Common HMI screen design mistakes
Most problem screens share the same handful of faults. The ISA overview names them directly:
| Mistake | Why it hurts | Better approach |
|---|---|---|
| Screens copied from the P&ID | Reflects engineering logic, not how operators monitor | Design around operator tasks |
| Spinning pumps, moving conveyors, animated flames | Constant motion hides the one thing that matters | Animate only alarm behavior |
| Bright 3-D vessels | Draws the eye to equipment that is fine | Flat, muted 2D shapes |
| Many crossing lines | Slows reading of the process | Simplify and align |
| Inconsistent color and misused alarm colors | Operators lose trust in what colors mean | One palette, written down |
| Haphazard navigation, no hierarchy | Time lost finding the right screen | Fixed bar and clear levels |
Add two more from experience. First, hiding diagnostic screens several clicks deep, so a technician under pressure cannot find the cause of a fault. Second, building the screen once and never revisiting it. ISA-101 takes a lifecycle view for a reason: operators will tell you what annoys them if you ask, and the design should improve with that feedback.
Also watch data entry. The ISA overview calls for techniques that reduce operator entry errors, such as limits on setpoint fields, units shown beside values and confirmation for critical changes. Our FactoryTalk button best practice article covers button behavior that avoids sticky or accidental presses.
HMI or SCADA: where screen design sits
People searching this topic often ask whether an HMI and SCADA are the same thing. They are not. An HMI is the operator-facing graphics layer, usually local to one machine or panel. SCADA is a supervisory system that gathers data from many distributed controllers, archives it and alarms on it across multiple operator clients. Tagsight’s explainer draws the same line: the HMI is a component, not a system.
The design principles in this article apply to both. A SCADA client still needs a hierarchy, restrained color and well-presented alarms. What changes is scale: more screens, more tags, and a stronger need for the written style guide.
Putting it into practice in FactoryTalk View
If you work on Allen-Bradley systems, the design ideas above map onto specific features:
- Set the display size and behavior first. Our guide to HMI screen display settings in FactoryTalk SE covers how the client opens and sizes displays, which affects every layout decision.
- Use a startup macro so the client always opens on the same overview screen. See the FactoryTalk SE client startup macro example.
- Build global objects for motors, valves and analog indicators, so a style change happens in one place. The page on HMI global objects and HMI server restoring is a good starting point.
- Study a ready-made process library. The Rockwell Process Library 3.5 HMI application page shows how standard faceplates and graphics are organized.
- Test communications early. A good screen showing stale data is worse than a plain one showing true data. See how an HMI communicates with a PLC program.
If you are deciding what to learn first, our HMI training course guide explains what to cover and how to choose, and the Allen Bradley HMI programming page covers FactoryTalk View SE in depth.
A quick review checklist before you release a screen
- Can an operator tell in one glance whether the process is normal?
- Is the background gray and is color used only where attention is needed?
- Do alarm colors appear nowhere except alarms?
- Does every important status have a second cue besides color?
- Do values show a scale or range, not only a number?
- Is the navigation bar in the same place as on every other screen?
- Can a technician reach the diagnostic screen for a fault from the screen where it appears?
- Does anything move on screen when nothing is wrong?
If any answer is no, fix it before commissioning, not after the first night-shift complaint.
Perspective: why design skill is learned by building
We see the same pattern with many of the engineers and technicians we teach. They learn where the buttons are in the software long before they learn what makes a screen work for someone running a machine at 3 a.m.
Our view is that HMI design should be taught alongside the PLC logic behind it. The screen is only as clear as the tags, alarms and states that feed it, and designing both together is how you get displays that make sense. That is why our training is built around real-life examples and practical strategies in industry-standard software such as FactoryTalk View Studio, rather than theory alone.
If you are building your first screens, start with the style guide and the overview screen. If you maintain existing ones, start with the alarms and the navigation. Small, consistent improvements add up faster than a full redesign.
the author
Learn HMI design with a real project
Reading about hierarchy and color helps, but the habits stick when you build screens and have someone review them. We offer on-demand PLC and HMI training, including FactoryTalk HMI training, and one-to-one help when you want feedback on your own project.

A 90-minute PLC coaching session is $97 per session, and online PLC coaching starts from $67 per session. If you want ongoing access to training content, the yearly PLC training membership is $192 per year. You can browse everything on our PLC training page.
FAQ
What is HMI screen design?
It is the practice of planning what an operator sees and does on the screens of a control system: layout, navigation, color, value presentation and alarm display. The goal is to help the operator recognize the state of the process and respond correctly, especially during abnormal situations.
What are the standard HMI screen design practices?
Common practices include gray backgrounds, limited and consistent color, no animation except for alarm behavior, embedded trends, indicators that show values against normal and alarm ranges, and logical navigation. They are laid out in the ISA overview of high-performance graphics and in the ISA-101 standards.
What is an HMI designer?
An HMI designer plans and builds the operator screens for a machine, line or plant. The role combines process understanding, knowledge of the control system and tags behind each display, and the design discipline described here. In many plants an automation engineer or controls technician does it.
Is an HMI the same as SCADA?
No. An HMI is the operator-facing display layer, often local to one machine. SCADA is a supervisory system that collects and archives data from many distributed controllers and presents it to multiple operators. HMI design principles apply to SCADA screens as well.
Sources
- High Performance Graphics to Maximize Operator Effectiveness (ISA)
- ISA-101 Series of Standards (ISA)
- Rockwell Automation Process HMI Style Guide
- How to design effective HMIs (Control Global)
- ISA-101: Toward a More Effective HMI Strategy (Yokogawa)
- Developing high-performance HMIs (Control Engineering)
- Advanced Control Room Alarm System: Requirements and Implementation Guidance (EPRI)
- Improving Operator Decision-Making Through Better HMI Design (Fuji Electric)
- Best Design Practices: How to Create High Performance HMI (IPD)
- Color Use in Process Displays (Provire)
- The high performance HMI (idc-online.com)
- What is an HMI (Tagsight)