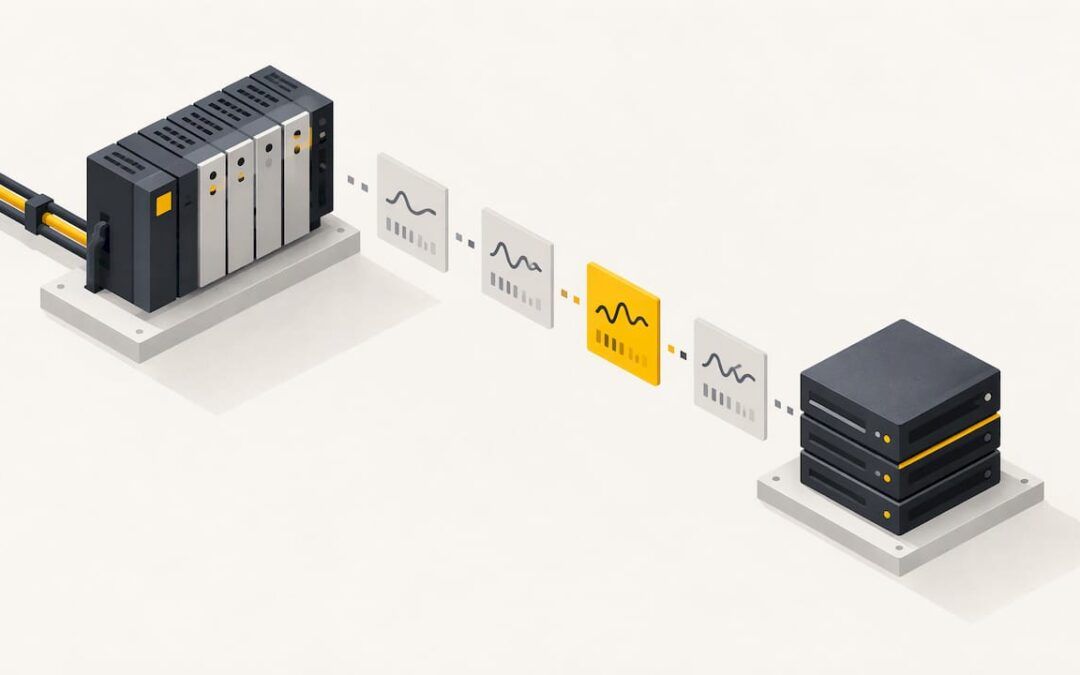
PLC logging means recording selected controller values, each with a timestamp, so you can review what the machine did after the fact. Done well, it answers the question every maintenance call starts with: what happened right before it stopped? Done badly, it gives you a huge file that misses the event you needed. This guide covers what to log, how to set sample rates, where the data should live, and how to find the cause when the log has holes.
TL;DR
- Log the chain of cause, not just the outcome: request, command, permissives, feedback, fault code and one process value. Logging only the command shows that the PLC turned something off, not why.
- Pick the sample rate from the fastest change you must see, then use change-based logging (deadbands) to keep file size under control.
- Buffer inside the controller or HMI first, then offload. Network drops and power loss are where most gaps come from.
- Keep every clock on the same time source. Timestamps you cannot trust make the whole log useless for root-cause work.
- Every platform has hard limits on points, intervals and file counts. Read the vendor’s logging help before you design.
Table of Contents
- What PLC logging is and what it solves
- Decide what to log before you touch the software
- Sampling: how often is often enough
- Four common logging patterns
- Configuring a logger: the settings that matter
- Timestamps: the part people skip
- Where the data goes: files, databases and historians
- Troubleshooting missing or wrong log data
- Common mistakes
- Our perspective: logging is a skill, not a menu option
- Build the skill with hands-on help
- FAQ
- Sources
What PLC logging is and what it solves
A PLC scans its program many times a second, but it forgets the past as it goes. Values in tags are only the present state. Logging adds memory: selected tags are written to a file, a database or a historian with a time attached.
Siemens describes its logging in WinCC Unified as a way to collect, process and log process data from an industrial system. Its listed uses are early detection of fault states, higher productivity, better product quality, optimized maintenance cycles and documentation of process value trends. The same ideas apply on any brand of controller.
In practice, logging solves four kinds of problems:
- Intermittent faults. A motor trips once a week and never while you are standing there.
- Slow degradation. A pump draws a little more current each month.
- Quality and traceability. You need to show that a batch ran at the right temperature for the right time.
- Production reporting. Counts, downtime and cycle times for the people who run the plant.
Each one asks for different tags and a different sample rate, which is why “log everything” is not a plan.
Decide what to log before you touch the software
Start with a written question. “Why does conveyor 3 stop intermittently?” gives you a tag list. “Collect data” does not.
For a motor that stops without warning, a useful diagnostic log has layers:
| Layer | Example tag | What it tells you |
|---|---|---|
| Request | Sequence run request, operator start | Whether something asked it to run |
| Command | PLC output or drive run command | Whether the PLC allowed it |
| Permissives | Guard closed, e-stop healthy, downstream ready | Which condition dropped out |
| Feedback | Contactor aux, drive running | Whether the field device obeyed |
| Fault | Drive fault code, overload bit | What the device reported |
| Process | Speed, current, pressure | What the load was doing |
If you trend only the command, the chart shows the PLC turning the motor off but never the reason. The layered list is what turns a trend into an answer.
Also decide units, scaling and the time source up front. A raw count of 16384 means little to someone reading the file next year. Name the engineering unit in the column header or in a tag description.
Sampling: how often is often enough
Time-based logging writes a record at every interval whether or not the value changed. Event-based logging (change of value with a deadband) writes only when the value moves by more than a set amount.
Do the arithmetic before you commit. One tag at one sample per second is 86,400 records per day. Five hundred tags at that rate is 43.2 million records per day, and most rows repeat the last one. A bearing temperature that sits at one value for a six-hour shift does not need thousands of identical rows.
A practical split:
- Slow analog values (temperatures, levels, tank pressures): log on change with a deadband, plus a periodic heartbeat so you can tell “unchanged” from “not logging”.
- Fast events (a jam, a trip, a short pressure spike): do not rely on a slow poll. A signal that flips and returns between two polls never appears in a polled log at all. Capture it in the PLC with a latched fault bit or a small timestamped queue, then let the logger read that.
- Counters and status bits: log on change.
Every platform also has a ceiling. Horner’s data log utility, for example, limits groups to 30 register variables each, with 10 groups and timers from 1 to 60 seconds or 1 to 1440 minutes. It also warns that logging faster than once per second is not advisable because it hurts scan rate. The lesson is general: logging is not free, and the controller pays for it in scan time.
Four common logging patterns
Most installations land in one of four patterns. Their ranges below are rules of thumb from field practice, not guarantees for your hardware.
| Pattern | Typical use | Main weakness |
|---|---|---|
| Controller writes straight to a database | Slow data, about 1 Hz or less, on a clean switched LAN | Samples are lost when the network drops |
| Local buffer on the PLC or HMI, then offload | Medium rates, standalone machines | Buffer fills if offload keeps failing |
| OPC server collecting from many PLCs | Plant-wide data, faster rates | A server outage loses data unless the collector buffers |
| SCADA or HMI native logging | Operator trends, alarms, reports | A power loss on the HMI leaves a gap |
The common advice for anything faster than about once a second is to buffer inside the PLC or HMI and let a server pull from that buffer. A database should not be asked to keep up with a scan cycle.
For small machines there is a simpler route. The CLICK PLUS from AutomationDirect logs up to 16 data points at an interval set by a trigger tag to a microSD card. Files are CSV, and you can limit the file count between 2 and 999, with the oldest file deleted when the limit is passed. That is a complete logging system with no PC at all, and it is a good fit for a standalone machine.
External serial loggers are another option for older controllers. One example, the FC-LOG, reads PLCs over DirectNET or Modbus RTU and writes date-time stamped CSV to a microSD card, so data survives power removal.
Configuring a logger: the settings that matter
The menus differ by brand, but the decisions are the same. The PLCnext Data Logger is a good example because its session editor exposes all of them:
- What to record: ports or variables.
- Sampling and publish intervals: sampling can follow the task cycle time or run slower, with a 100 ms default.
- Data sink: an SQLite database, a time-series database or volatile RAM.
- Buffer and write interval: the write interval defaults to 1000 records so the SD card is not written to constantly.
- Rollover and file limits: what is deleted when space runs out.
- Store changes: log only when a value changes.
- Timestamp: controller system time, UTC, with 100 ns precision.
Its commissioning guide also notes that the volatile option lives in controller RAM and is deleted on shutdown. That is fine for a live trend and wrong for evidence.
Do the storage math
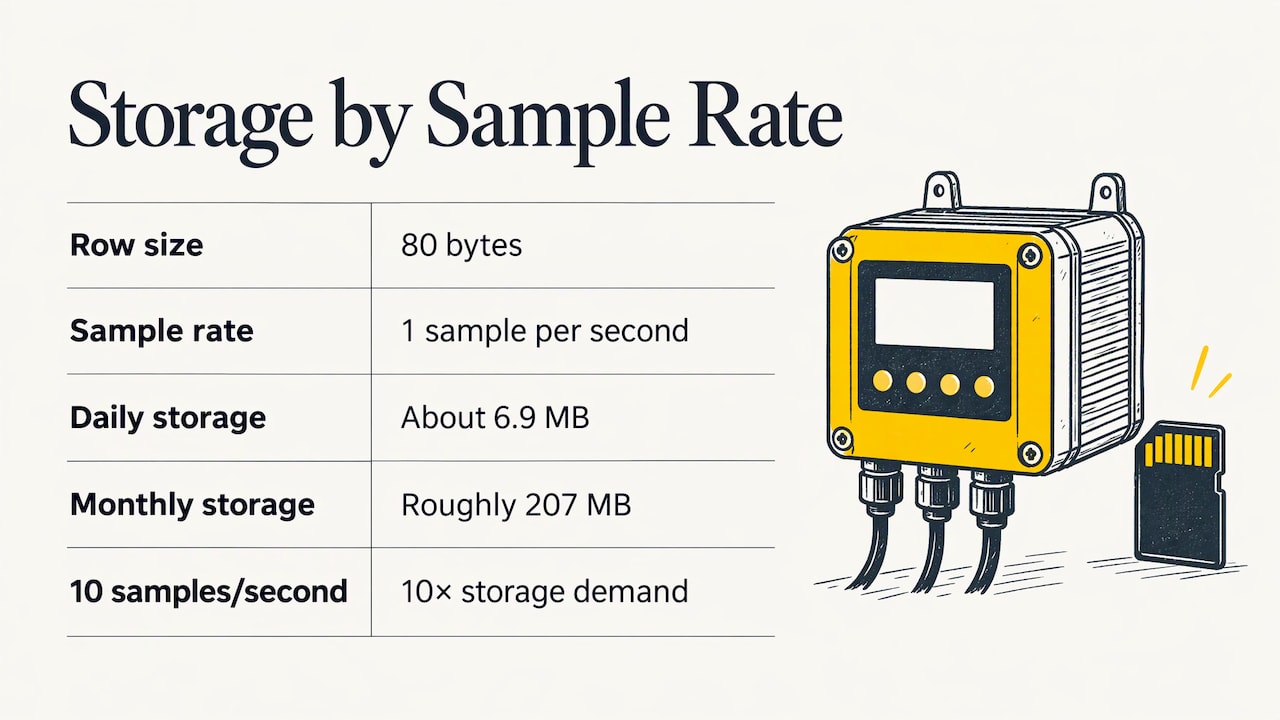
A row of 80 bytes at one sample per second is about 6.9 MB per day, or roughly 207 MB per month. Ten samples per second multiplies that by ten. Work out the figure for your tag count, then compare it with the card or disk and the retention you need. Decide what happens at full: stop, wrap around or delete the oldest file. Silent wrap-around is how a fault from three weeks ago disappears just when someone asks about it.
Protect the media
Storage cards wear out under constant writes. AutomationDirect recommends an industrial microSD card rated for higher temperatures and heavier write loads, and prefers SLC flash for the longest life. A consumer card in a hot panel is a common reason logs stop with no warning.
Respect the buffer
Horner’s utility logs each group into an internal RAM buffer before writing to media. If that buffer fills, data is lost, and the fix is a longer logging interval. ABB’s CSV logging library makes a similar point: it advises a buffer larger than the number of zones times two, and a log trigger slower than one second to avoid losing entries. Size every buffer for the worst burst of events, not for the average.
Timestamps: the part people skip
A log is only as good as its clock. If the controller says a fault happened at one time, the HMI PC at another and the database server at a third, you cannot put events in order, and cause and effect become guesswork.
The fix is simple to state:
- Choose one time source for the plant and point every controller, HMI computer and server at it.
- Timestamp in the controller whenever you can, not when the data arrives at a SCADA system, because polling delay and network lag change the arrival time.
- Store in UTC where possible and convert only for display. That avoids daylight saving confusion.
- Check drift on a schedule, not only after a problem.
On Allen-Bradley platforms the details depend on the generation. The ControlLogix 5380 supports CIP Sync, while older controllers need NTP through an EtherNet/IP module. Check Rockwell’s documentation for your exact hardware before you plan the clock architecture.
Where the data goes: files, databases and historians
CSV on removable media is the simplest and works well for one machine. It opens in Excel, which is how most maintenance teams will actually look at it.
A database (SQL) suits reports and queries across many machines. Treat it as a store for modest data rates. Index sensibly, partition by time period, and drop tags that nobody ever queries.
A historian is built for large volumes of time-series data, with compression and fast trend retrieval. It is the right tool when you have thousands of tags and years of retention.
HMI and SCADA trends are for operators. They are quick to set up and good for what is happening now, but they are the first thing to lose data when the HMI loses power.
Whatever you choose, write down how long each tier keeps data, who owns it and how it is retrieved. Retention that only exists in one engineer’s head ends when that engineer changes jobs.
Troubleshooting missing or wrong log data
Work from the data source toward the storage, and collect timestamps as you go.
Nulls and blank values
Open Automation Software’s logging troubleshooting guide says a null is written when the tag’s data quality is bad, or when the tag name is wrong or does not exist. Tag names are case sensitive, so check spelling and capitalization first.
Gaps in the trend
Check these in order:
- Buffered data waiting to be resolved. In the same guide, when an unresolved error occurs, data is buffered in a store-and-forward directory, and buffered data must be resolved before current data is logged. Look for waiting files.
- Collector restarts. A basic collector without store-and-forward buffering loses whatever passes while it is down.
- Clock jumps. A time correction that moves the clock backward can make a historian reject samples that look out of sequence.
- Scan rate too slow. A change that starts and ends between two polls is never seen. Speed up the poll or capture the event in the PLC.
- Bad tags in a poll group. One undefined or wrongly addressed tag in a large OPC group can slow the whole group.
Factry’s collector documentation offers a useful reminder: missing data is not always the collector’s fault. It can come from the device, the network or the historian configuration, and running collectors as close to the data source as the network allows reduces network-related loss.
Plausible but wrong values
With Modbus devices, a response proves the link works, not that the number is right. Address offsets, register type, byte and word order, scaling and signedness can all produce a reasonable-looking wrong value. Keep the raw request, the raw response and the device manual’s register map side by side while you diagnose. If one device goes bad alone, suspect its interface or configuration. If many devices behind one gateway fail together, suspect the gateway, switch, power or polling service.
Common mistakes
- Logging everything at full speed. It fills storage and slows every query, while a 5-second interval still misses a 2-second spike. Use deadbands plus a heartbeat.
- Logging the output but not the reason. Add permissives, feedback and fault codes.
- Logging too fast on the controller itself. It costs scan time. Keep intervals realistic and read your platform’s limits.
- No buffer, no store-and-forward. Any network blip becomes a permanent gap.
- Mixed clocks. Pick one source of truth.
- No retention plan. Decide what is kept, for how long and who can retrieve it.
One more point if you publish your own internal standards or training notes on a website: a structured data audit can check that the markup on those pages is readable by search and AI tools.
Our perspective: logging is a skill, not a menu option
Most logging problems we see are not software problems. They are design problems: nobody wrote down the question the log was meant to answer, so the tag list, the interval and the storage were all guesses.
When we teach this, we start from a real fault on a real machine and work backward. Which signals would have shown the cause? How fast does the shortest one change? Where can the controller hold it until something collects it? That sequence works whether the logger is a microSD slot on a small PLC or a Studio 5000 project feeding a plant database.
Our training is built around practical examples with industry-standard software such as RSLogix 500, Studio 5000 and FactoryTalk View Studio, because the confidence to design a log comes from having built one and watched it fail. We would rather you learn it on a practice project than on a line that is down.
the author
Build the skill with hands-on help
If you want to move from reading about logging to building it, we have options for different needs. Our PLC training courses cover Allen-Bradley programming and related topics, and the Yearly PLC Training Membership is $192 per year. If you have a specific machine and a specific logging problem, a 90-minute PLC coaching session is $97 per session, and Online PLC Coaching starts from $67 per session.

If your logging runs on Allen-Bradley hardware, our guide to Studio 5000 produced and consumed data shows one way to move values between controllers, a common first step before anything gets logged. For a broader look at how the pieces fit, see our overview of the PLC programming system.
FAQ
What is the difference between a PLC data logger and an ordinary data logger?
A PLC data logger records values from the controller, sensors and process with a timestamp, so it ties data to what the control program was doing. An ordinary data logger records sensor signals independently of any control system. For fault diagnosis, the PLC version is more useful because it can include commands, permissives and fault codes.
How fast should I log PLC data?
Log as slowly as your question allows. Slow analog values are usually fine on change with a deadband and a heartbeat. Short events should be caught inside the PLC with a latched bit or timestamped queue rather than by faster polling. Your controller’s documentation will state its minimum interval and the limits on points.
Where should I store PLC logs?
For one machine, CSV on an industrial-grade microSD card is often enough. For many machines, use a database or historian fed from a buffer in the PLC or HMI. Choose based on data rate, retention and who needs to retrieve it.
Why does my log have gaps?
Common causes are a full buffer, a collector restart without store-and-forward, a clock correction, a poll interval slower than the event, or a bad tag in a poll group. Check timestamps around the gap and look for buffered files waiting to be resolved before changing anything else.
Sources
- Data logging (RT Unified), Siemens WinCC Unified
- Datalogging, Horner Automation
- Data Logging Setup, AutomationDirect CLICK
- FC-LOG data logger manual, Interconnecting Automation
- Data Logger Session editor, PLCnext
- Data Logger Configuration, PLCnext
- Logging data into a CSV file, ABB
- Troubleshooting data logging, Open Automation Software
- Collectors, Factry documentation