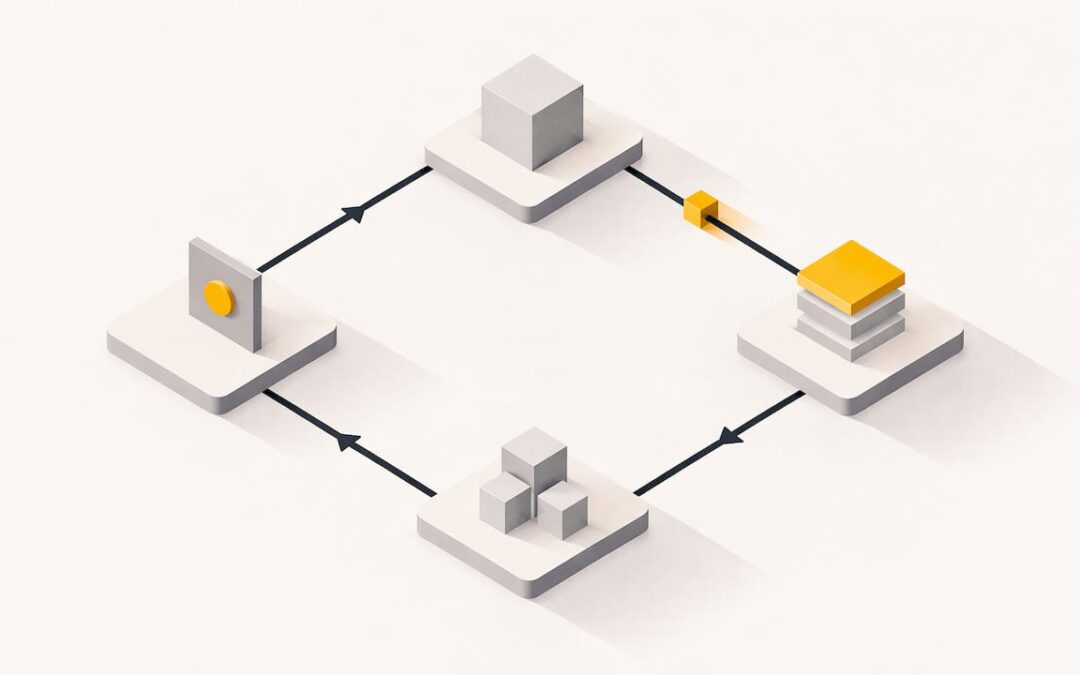
The PLC scan cycle is the loop a controller repeats forever: read the inputs, run your program, update the outputs, then handle housekeeping such as communications and diagnostics. Scan time is how long one trip around that loop takes. It is not the same as how fast your machine reacts, and that difference causes most of the confusion, and most of the late-night troubleshooting calls, around this topic.
This guide explains each stage, what scan time includes, why it changes from one scan to the next, how to read it on the major platforms, and what to do when it gets slow.
TL;DR
- A scan cycle is a repeating loop: input scan, program scan, output scan, and housekeeping (communications and internal diagnostics).
- Scan time is the duration of one loop. Response time, from a real-world input change to an actuator moving, is longer and depends on more than scan time.
- Scan time varies. Interrupts, communications and program branches change it from cycle to cycle, so watch the maximum, not just the last value.
- You can read scan time in software: GSV instructions on Logix controllers, system words on Schneider M340 and Quantum, and online tools or RT_INFO on S7-1500.
- When scan time creeps up, trend it, find what correlates with the spikes, and fix the cause before touching watchdog settings.
Table of Contents
- What the PLC scan cycle is
- A simple example of a scan in action
- Scan cycle vs. scan time
- What affects PLC scan time
- Scan time is not response time
- How to check PLC scan time
- Troubleshooting a slow or variable scan
- Our perspective
- Build this skill with hands-on training
- FAQ
- Sources
What the PLC scan cycle is
A PLC does not react to events the way a computer program with interrupts might. It works in a loop. AutomationDirect’s PLC handbook lists the stages as an input scan that reads the input devices, a program scan that executes the user logic, an output scan that energizes or de-energizes the outputs, and housekeeping for communications and internal diagnostics.
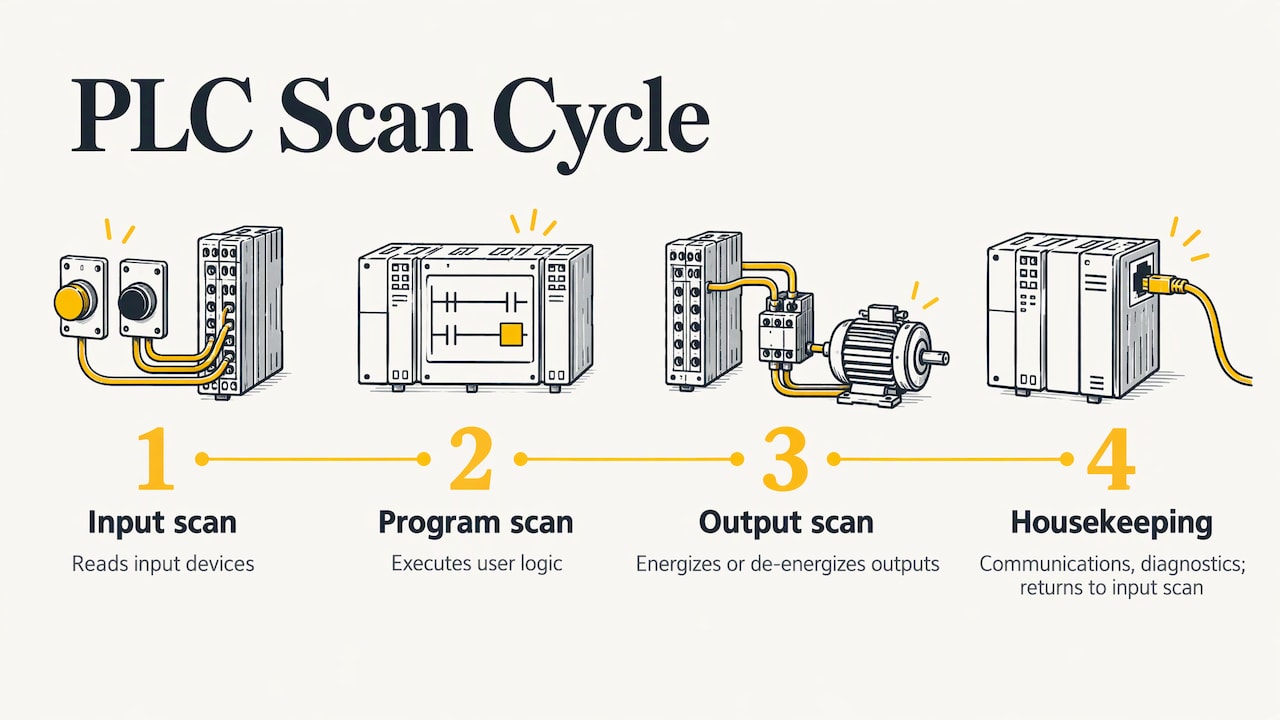
Many beginner explanations show three steps and leave housekeeping out. Both descriptions are correct. The three-step version is what you reason about as a programmer. The four-step version is closer to what the CPU actually does, and it explains why a chatty network or a busy HMI can slow your logic down.
Stage 1: input scan
The controller reads the physical inputs and copies their states into memory, usually called the input image or input data table. A closed pushbutton becomes a 1, an open one a 0, and analog values become numbers.
The copy is deliberate. Your logic then works from a stable snapshot instead of from wires that can change at any instant.
Stage 2: program scan
The CPU executes your logic from the start of the program to the end, usually top to bottom and left to right in ladder. Results are written to the output image, not directly to the terminals.
Because of the snapshot, an input that flips partway through the scan is normally not seen until the next scan, as the ASP Wiki on scan cycle and task execution explains. This is the intentional, deterministic behavior of the image-table model: every rung in a scan sees the same input picture.
Stage 3: output scan
The controller copies the output image to the physical outputs. Contactors pull in, valves shift, indicator lamps change. Until this step, nothing your logic decided has touched the real world.
Stage 4: housekeeping
The CPU services communications, updates internal diagnostics and handles system tasks. On a modern controller, this work may be time-sliced or run in the background, but it still competes with your program for CPU time. That is why adding a busy HMI or a new message instruction can raise scan time even though you did not change a single rung.
A simple example of a scan in action
Picture a start pushbutton wired to an input, a seal-in rung, and a motor contactor on an output.
- You press the button halfway through the program scan. The input image does not change yet.
- The scan finishes. The output scan runs with the old results. The motor stays off.
- The next input scan sees the pressed button. The program scan energizes the motor bit in the output image.
- The output scan writes that bit to the contactor coil. The motor starts.
The delay between press and start is somewhere between one and two scans of logic, plus whatever the input filter and output hardware add. On a typical machine that is milliseconds and invisible. On a fast packaging line or a high-speed registration application, it is the difference between working and not working.
If you want to practice this behavior on something concrete, the Allen-Bradley traffic light exercise is a good small program to step through and watch rung states change scan by scan.
Scan cycle vs. scan time
The scan cycle is the process. Scan time is the measurement of it. The distinction matters because vendors define the measurement slightly differently.
Siemens defines S7-1500 cycle time as the time needed for process-image I/O updates, cyclic program execution, all program and system activities that interrupt the cycle, and any configured waiting for a minimum cycle time. The S7-1500 cycle and response times manual spells this out. The key point is that your own logic is only one part of that number.
Siemens support also notes that scan-cycle time covers the cyclic program, interrupting organization blocks, system activities, process-image updates and other active logic, so it is not necessarily identical from cycle to cycle. A program with branches, jumps or conditional routines will take longer on some scans than others.
Why a minimum cycle time exists
Some controllers let you set a minimum cycle time. If the program finishes early, the CPU waits, which makes the cycle more consistent and leaves processing time for communications. The Siemens manual counts that configured waiting as part of cycle time. A fixed cycle is useful when you run calculations that depend on a constant interval, but it also means a longer scan time is not always a sign of trouble.
Cycle control point
Siemens documents the cycle control point as the end of one cycle and the start of the next. At that point the CPU writes the process-image outputs and reads the process-image inputs. Other platforms have the same idea under different names, so when you move between vendors, ask where the image refresh happens and which tasks it covers.
What affects PLC scan time
The Siemens manual lists the main factors: program size and execution time, I/O update time, communications, interrupts, task priorities, minimum-cycle settings, network and module timing, and input filtering. In practice, check these first:
| Factor | What it does | What to look at |
|---|---|---|
| Program size and complexity | More instructions take more time to execute | Long loops, large array operations, heavy math |
| I/O count and type | More modules and slower modules lengthen the I/O update | Remote racks, analog and specialty cards |
| Communications | Message handling, HMI polling and drive or device traffic take CPU time | Number of connections, update rates |
| Interrupts and periodic tasks | Higher-priority tasks pause the main program | Task periods, priorities, overlaps |
| Minimum cycle setting | Adds waiting time by design | Controller configuration |
| Input filtering | Delays when a signal counts as changed | Module filter settings |
Interrupts and tasks
On Logix controllers, work is organized into tasks. A periodic task interrupts the continuous task, so the continuous task’s scan time stretches when a periodic task fires. Rockwell’s safety task documentation states that a periodic safety task interrupts the continuous task, and that its configured period directly affects system reaction time.
This shows why a configured period and an actual execution time are different things. The period controls how often a task is released. The watchdog bounds how long it may take to finish.
If you work in Studio 5000, our RSLogix 5000 task monitor tool walkthrough shows how to see processor usage per task, which is usually the fastest way to find out which task is eating your CPU.
Operator panels and field devices
Everything that feeds an input scan matters, including the buttons operators actually press. Hardware such as custom membrane switch control panels ends up as ordinary discrete inputs, and their contact quality and debounce behavior affect how cleanly the controller sees a press. Pair that with sensible input filtering and the scan model works for you rather than against you.
Scan time is not response time
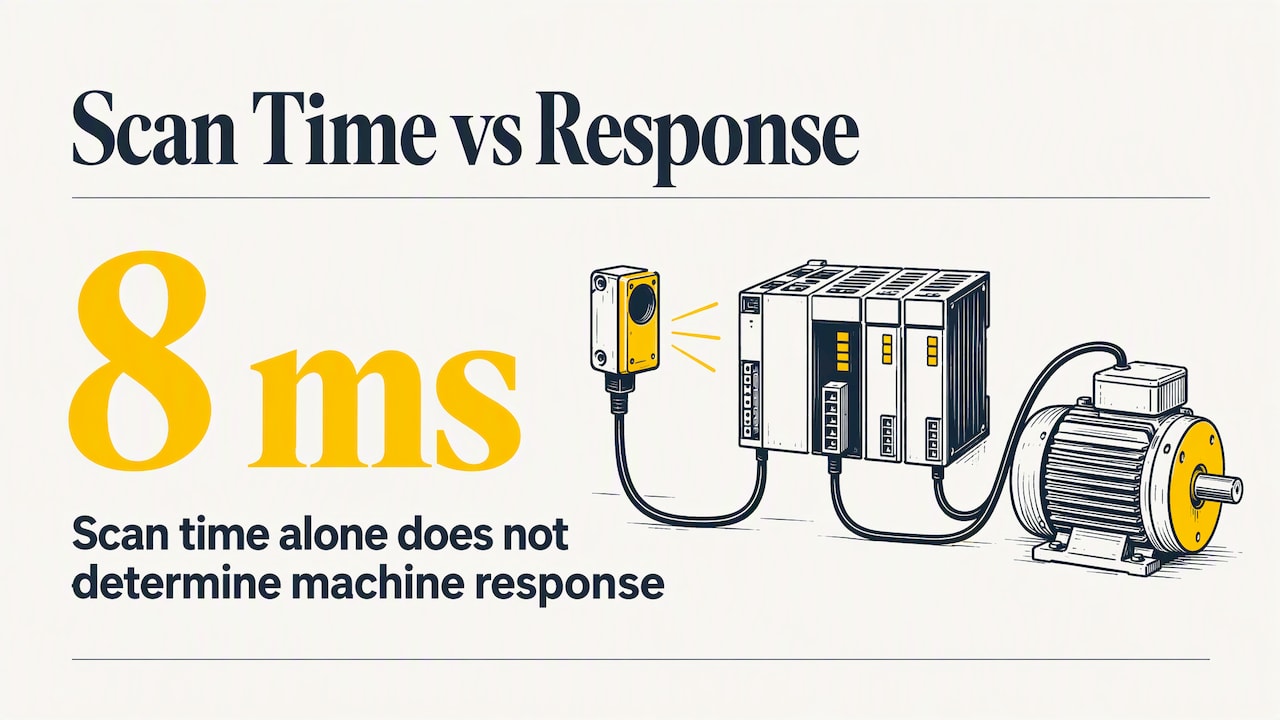
This is the point that trips up the most people. If your scan time is 8 ms, your machine does not necessarily respond in 8 ms.
ParttoGo’s timing-path explainer describes scan time as only part of the path from a physical input change to an actuator response. Sensor filtering, I/O transfer, task release, logic execution, output transfer, device response and mechanical motion can all add delay.
Siemens makes the same engineering point: response time is determined by processing cycles and the conditions that influence them, not by user-program execution alone. A physical input may wait for acquisition and task release, then logic and output paths add more delay. The result depends on when in the cycle the signal arrives and on how loaded the system is.
Best case and worst case
The signal arrives at a random point in the cycle. The best case is that it lands just before the input scan. The worst case is that it lands just after, so it waits almost a full cycle before it is even read, then waits through the logic and the output update. When someone quotes a response time, ask four things: what event starts the clock, what event stops it, what operating mode applies, and whether the figure is typical or worst case.
When it matters
For tank levels, conveyors and most process equipment, scan time is far faster than the process. It matters for high-speed counting, fast pulse signals, tight motion control and safety reaction times. For those cases, controllers offer interrupt tasks, high-speed counter modules, or hardware that handles the signal independently of the scan. If your application includes servo axes, our servo motion training covers how motion tasks are organized so the axis does not depend on a slow main scan.
How to check PLC scan time
Every major platform exposes scan time in software. These are the documented methods.
Rockwell Logix controllers
Rockwell documents GSV attributes for last scan time and maximum scan time on programs and tasks, as well as the task watchdog attribute. The GSV/SSV programming example shows the pattern. Read LastScanTime and MaxScanTime into tags with a GSV instruction, then trend or display them. You can also see task scan times in the task properties while online.
Schneider Electric M340 and Quantum
Schneider Electric states in its US support FAQ that you can read scan execution times from system words: %SW30 for the last scan, %SW31 for the longest scan and %SW32 for the shortest. You can watch them in an animation table.
Siemens S7-1500
Siemens says S7-1500 cycle-time statistics can be viewed in the online tools of STEP 7, or obtained with the RT_INFO instruction. They include the shortest and longest cycle time and the runtime portions used by communications and the user program. That split is very useful: it tells you whether your logic or your communications load is the problem. If you are just getting started on this platform, our TIA Portal S7-1200 processor lesson walks through the CPU setup.
What to record
A single reading is almost useless. Capture these over a full production cycle, including startup, changeovers and fault conditions:
- Last scan time, to see the current state.
- Maximum scan time, since this is what trips watchdogs.
- Minimum scan time, to see how much the cycle varies.
- Which tasks were active when the maximum occurred.
Troubleshooting a slow or variable scan
When a machine is sluggish, intermittently late, or faulting with a watchdog error, work through the problem in order.
- Establish a baseline. Trend last and maximum scan time. Industrial Monitor Direct’s scan time guide recommends this, along with checking task overlap or watchdog indicators. These are practical heuristics rather than vendor rules, so treat them as a starting point.
- Correlate spikes with events. Look for a link between scan-time spikes and communications activity, HMI polling, firmware changes or long conditional routines. A spike every time someone opens a particular HMI screen points at tag polling, not at logic.
- Split logic from overhead. Where the platform shows it, compare user-program time with communications time. Fixing a communications load will not help if the logic is the cost, and the reverse is also true.
- Check task configuration. Periods that are too short for the task’s execution time cause overlaps. Priorities that let a minor task preempt a critical one cause jitter.
- Simplify the code. Large loops, array copies done every scan, and routines that run when nothing has changed are the usual culprits. Run them on a trigger or spread them across scans.
- Only then adjust the watchdog. A watchdog is the maximum time allowed from task start to task completion. Rockwell’s safety documentation gives an example where the safety-task watchdog is set at least 5 ms above the measured maximum scan time. That is a guide from one example, not a universal margin. Raising a watchdog to hide a slow task does not fix the task.
HMI design is often the hidden cause in step 2. Our lesson on how an HMI communicates with a PLC program shows how screens and tags generate traffic the controller has to serve.
A worked example
Suppose a line’s maximum scan time doubles every afternoon but the average looks fine. You trend the maximum and see the spikes line up with a shift supervisor loading a report screen on the HMI. The screen subscribes to hundreds of tags at a fast rate. You reduce the update rate and group the tags, and the maximum drops back. Nothing in the ladder logic changed. Without the trend and the correlation, you would have spent days searching the program.
Our perspective
We see the same pattern with most people learning controls. They memorize “inputs, logic, outputs” and then get stuck the first time a real machine behaves oddly, because the textbook loop leaves out the parts that cause the oddness: tasks, communications, filtering and the gap between scan time and response time.
Our training is built around practical, real-life examples for that reason. We would rather you watch a scan time spike on a live project, trace it to its cause and fix it than recite a definition. The same habits carry across platforms: look at the maximum, not the average; ask what starts and stops the clock; and check the task structure before blaming the code.
That is also why we teach with industry-standard software, including RSLogix 500, RSLogix 5000, Studio 5000 and FactoryTalk View Studio, and keep the material current. If you can read the scan numbers on one platform, you can find them on any other.
the author
Build this skill with hands-on training
Understanding the scan cycle on paper is the easy part. Seeing it on a live controller, with tasks, an HMI and real I/O, is what makes it stick. We offer on-demand PLC and HMI courses for Allen-Bradley platforms, from beginner programming through servo motion and FactoryTalk View, on our PLC training page.
If you would rather work through your own controller or a scan-time problem directly, a 90-minute PLC coaching session is $97 per session, and online PLC coaching starts from $67 per session. For ongoing learning, our yearly PLC training membership is $192 per year, and our team also takes on project work. Details for both are on the PLC programming services page.
FAQ
What are the steps of the PLC scan cycle?
The core steps are the input scan, the program scan and the output scan. Many controllers also run housekeeping, which covers communications and internal diagnostics. The loop then repeats continuously while the PLC is in run mode.
What is a normal PLC scan time?
There is no single normal value. It depends on the controller, program size, I/O and communications load, and it varies from scan to scan. What matters is that your maximum scan time stays well inside your watchdog setting and fast enough for the process you control.
Is PLC scan time the same as response time?
No. Scan time is the duration of one loop. Response time runs from a physical input change to an actuator response and also includes input filtering, I/O transfer, task release, output transfer, device response and mechanical motion. It also depends on where in the cycle the signal arrives.
How do I see the scan time in my PLC?
It depends on the platform. On Logix controllers, use GSV to read LastScanTime and MaxScanTime. On Schneider M340 and Quantum, read %SW30, %SW31 and %SW32. On S7-1500, use the STEP 7 online tools or RT_INFO.
Why does my scan time keep changing?
Because the cycle includes more than your main logic. Interrupting tasks, communications, system activities and conditional code branches all change the duration of individual scans. Trend the maximum value and correlate spikes with events to find the cause.
Sources
- PLC Handbook, AutomationDirect
- PLC Scan Cycle and Task Execution, ASP Wiki
- SIMATIC S7-1500 Cycle and Response Times function manual, Siemens
- Scan time, Siemens Industry Support forum
- PLC Scan Time vs Response Time, ParttoGo
- GSV/SSV Programming Example, Rockwell Automation
- How to obtain scan execution times in M340 and Quantum PLC, Schneider Electric
- Safety Task, Rockwell Automation
- PLC Scan Time: How to Measure, Monitor, and Optimize, Industrial Monitor Direct
- Custom membrane switch control panels, G&D Elektronik